A lot is made of Felipe Anderson with many fans on either side of the argument steadfast in their beliefs. For those that rate Felipe believe him to be misused and often made the scapegoat. People on the other side of the fence believe him to be lazy, a bottler in a challenge & not effective going forward. So I thought I would review if this was a matter of perception or fact supported by statistics. I will look at how he has performed defensively, in attack & while passing the ball.
Lazy Defending or Underappreciated
So, the first thing Anderson is often criticised for is his lack of commitment to a tackle & in defensive engagements. For fairness I have compared last season’s data with our current year also comparing against Declan Rice & Robert Snodgrass. Upon review the data last season Anderson was engaged in 6.77 defensive duels per 90 which placed him second against our comparisons. What is interesting is that Anderson’s success rate being 3.54% higher than that of Snodgrass but committing less fouls per 90 at a rate of 0.52. This then led me to question does the fact that Snodgrass commits double the fouls per game to Anderson, add to the perception one is far more committed than the other? Or, does this show that Anderson is more measured when engaging defensively & efficient in stopping his opponent. To try & understand this further it’s important that we access the figures from this season where Anderson has been polarised by fans the most defensively, whereas the likes of Snodgrass praised. This season Anderson has been involved in 7.56 duels per 90 only bettered by Declan Rice by 0.10 duels & 1.74 more duels than Snodgrass. When we review the percentages Anderson & Rice win 59.03% of theirduels as opposed to the 50% won by Snodgrass. Anderson has also committed more fouls this year as is 0.33 more likely to commit a foul but commits less than 0.31 fouls to Snodgrass. These stats would point that Anderson is playing deeper than his debut season & having to commit more to defensive situations to compensate for others. Due to Anderson having to be engaged in more defensive duels & sitting deeper Anderson the likelihood to incept the ball has dropped by 1.09. Although, the rate of interceptions has dropped Anderson still has the 2nd highest interception rate at West Ham & bettering Snodgrass by 1.16 per 90.
In the below images we can see two instances where both Anderson & Snodgrass commit fouls to highlight the types of engagements they experience/create.
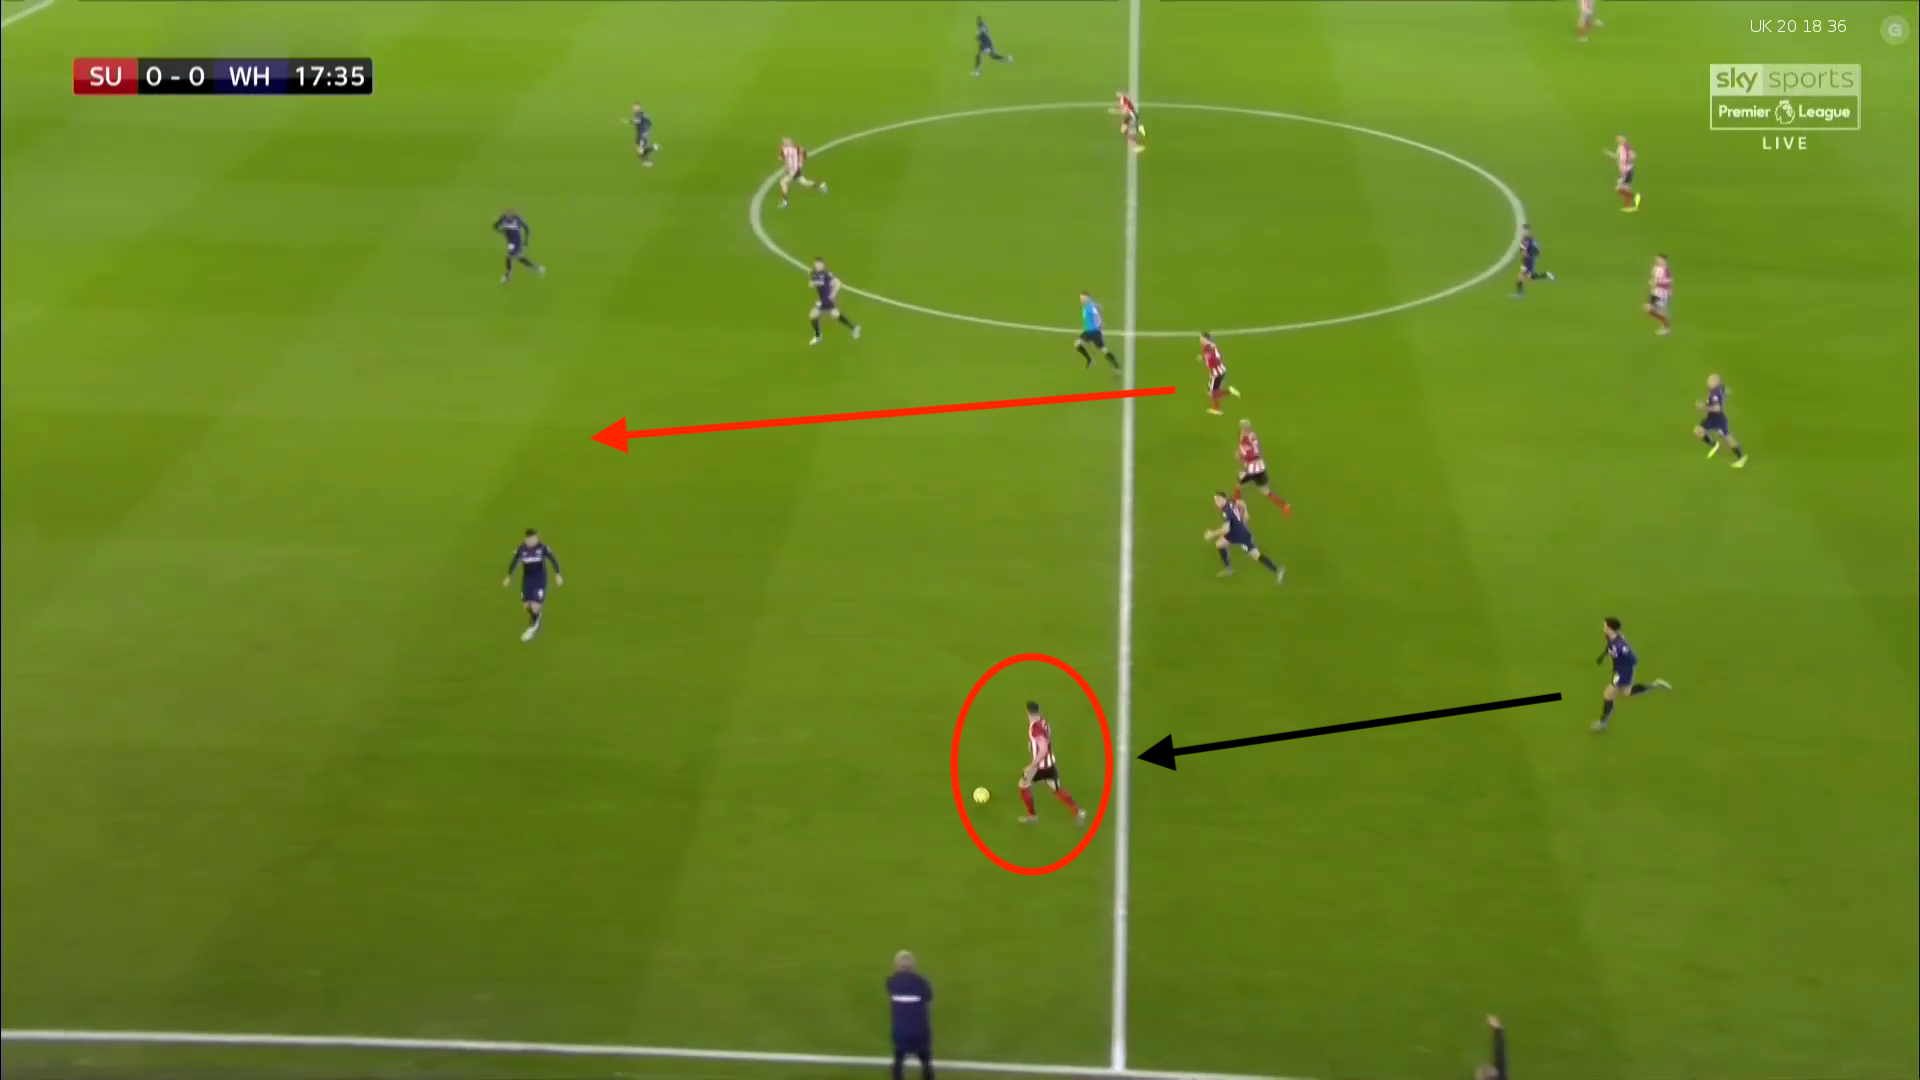
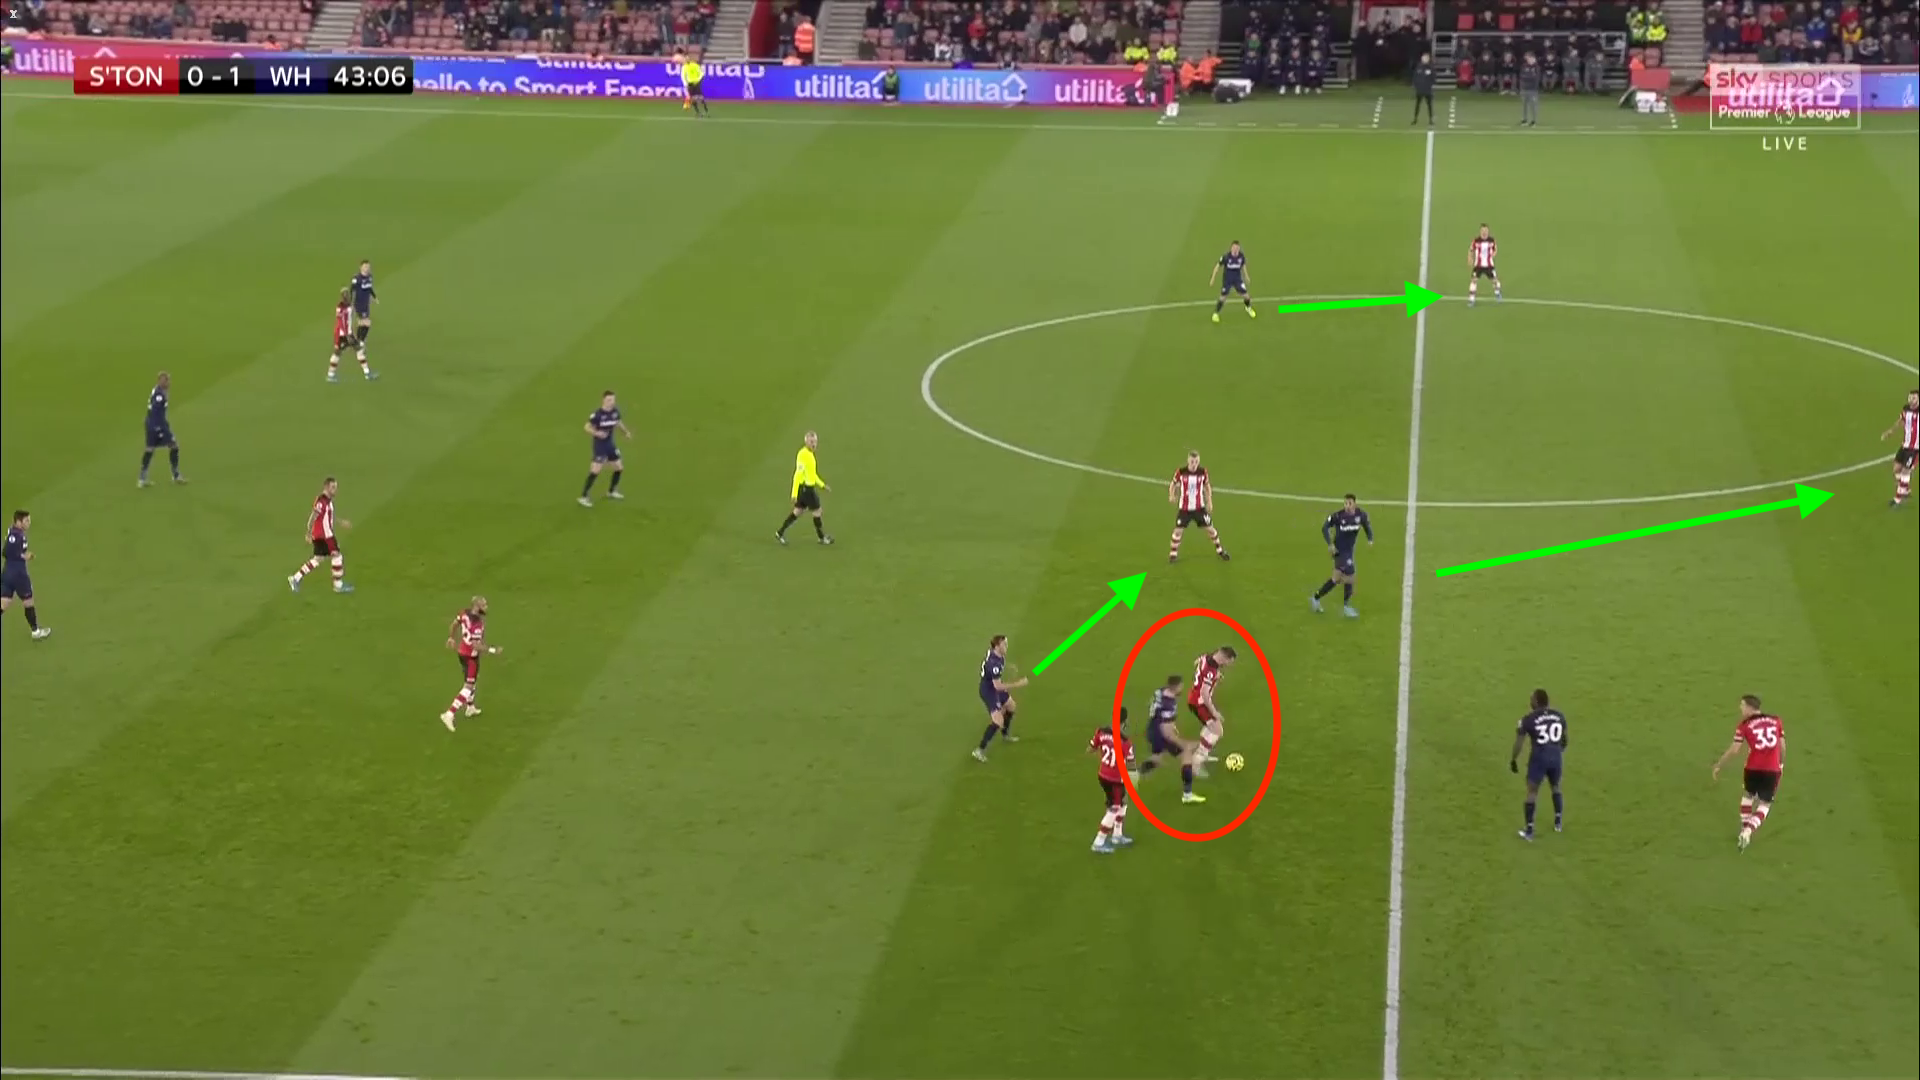
In the left hand image Sheffield United are building the attack from the right with Anderson looking to engage quickly & help out his full back. Anderson comes into contact with the wing back for Sheffield United & stretches out a leg to try & nick the ball off his opponent. Unfortunately, the wing back anticipates & pushes the ball slightly further ahead to win the foul. Had Anderson waited to engage this could have allowed Fredericks time to engage. In this sequence there was danger with a Sheffield United player running into the channel vacated by the right back & the foul stopped the attack in a non threatening area of the pitch. In the right hand image the Southampton midfielder is shielding the ball & under pressure with West Ham providing good cover ensuring all passing options are limited. Snodgrass rather than hold position engages aggressively being easily turned & ultimately fouls the player. Had he jostled into position West Ham players where ideally placed to pressure the midfielder in a 2 on 1 & initiate any of the passing options.
| Duels per 90 (18/19) | Duels won % (18/19) | Interceptions per 90 (18/19) | Fouls per 90 (18/19) | Duels per 90 (19/20) | Duels won % (19/20) | Interceptions per 90 (19/20) | Fouls per 90 (19/20) | |
| Rice | 7.15 | 67.69 | 5.18 | 0.51 | 7.66 | 59.03 | 5.32 | 0.82 |
| Anderson | 6.77 | 54.51 | 4.14 | 0.72 | 7.56 | 59.03 | 3.05 | 1.05 |
| Snodgrass | 6.75 | 50.97 | 2.33 | 1.24 | 5.8 | 50 | 1.89 | 1.36 |
In my view Anderson’s defensive work is often underappreciated & ignored as his aggression in the tackle is tempered with composure. In reviewing clips of Snodgrass who is revered as “dogged” & “determined” there is a recurring rashness to challenges & poor timing. This assertion is backed by the statistics on Snodgrass success rate in defensive situations. Anderson has in fact improved defensively this season to last & across most stats is only second to Rice, and yet is classed as lazy defensively.
Due to West Ham having to defend more this season than last a focus has been placed largely on Anderson’s defensive attributes. What can be gleaned from these stats is more often than not he outperforms all midfielders bar Declan Rice defensively. To put that into a greater context Anderson & Rice win the same percentage of duels per 90 (59.03%), yet the left winger is criticised for not winning more.
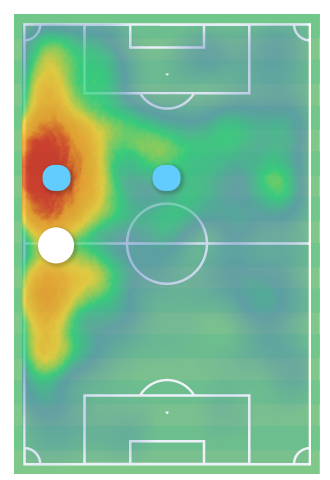
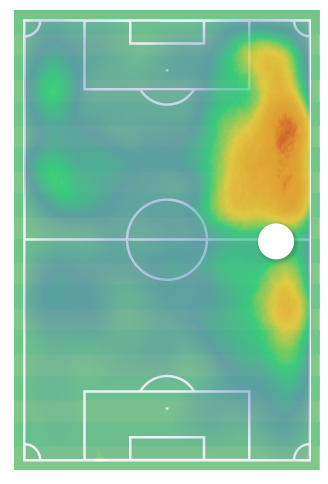
The below heat maps of Anderson (left) & Snodgrass (right) show that our wingers have to do a lot of covering for the full backs. Additionally, it must be noted that those playing in the left channel spend most of their time in the middle third of the pitch rather than the final part where they offer the most threat.
It could be argued there is a misconception as to his defensive prowess & other less accomplished players have been elevated above for no quantifiable reason beyond perception.
Attacking
It has been a bit of a mixed bag for Anderson this season when we look at the attacking statistics. I for one have been disappointed in Anderson’s output this season, but once reviewing against others in the team I have been guilty of underappreciating his efforts. I have mentioned in a previous blog that I feel Anderson has been having to start deeper than previously when engaging in attack, and this has had a detrimental effect our play & his outputs too. Once again, I will compare Anderson’s attacking outputs against his teammates this time Antonio, Snodgrass & Diangana (on loan with West Brom). Although, in my view Anderson as started deeper his holds the most dribbles per 90 with 7.20 with a success rate of 55.47% which betters all in this comparison section. For those interest Yarmolenko has the highest success rate of 60.66% (4.55 dribbles per 90). The stats for Anderson would show that he is constantly available for the ball & pushing the team further up the pitch 0.46 attempts more than Antonio, & 3.4 attempts more than Snodgrass. Within the squad on two “dribblers” of the ball have a better success rate (Yarmolenko & Lanzini) but the number of dribbles is considerably less. Therefore, without Anderson there is a very heavy burden on Antonio to carry the ball with Bowen is the next prolific carrier at 5.18 dribbles per 90.
For me I feel a lot of the frustration with Anderson predominately boils down to his goals & assists not being higher enough. In reality last season Anderson overperformed with 10 goals when statistically based on chances was expected to only score 5.25 goals. His teammates also should have enabled him more assists too with expected assists 5.47 but poor finishing limited it to 4 assists. Fast forward to this season Anderson is performing almost in line with the expected goals & assists metric with 6 assists (xA 4.6) & 1 goal (xG 2.07). By comparison the second in the ranking for assists is Snodgrass on 5, but his effectiveness in open play is less with 4 coming from set pieces. These stats show that Anderson is overperforming when supplying for his teammates with a lower rate of expected success than his debut season. The rate of expected goals & tally would also support that Anderson is having to play deeper, therefore unable to find positions to score as previously demonstrated. What is a concern is the drop in shots on target by Anderson dropping by 10.74% this could be related to confidence but in some cases a result of lacking concentration when required. As a side note it is encouraging to see Antonio has vastly improved on his shot on target % by 2.21
| Shots on target % (18/19) | Dribbles per 90 (18/19) | Dribbles Success % (18/19) | Assists (18/19) | Expected Assists (18/19) | Goals (18/19) | Expected Goals (18/19) | |
| Anderson | 44.07 | 7.09 | 51.69 | 4 | 5.47 | 10 | 5.25 |
| Antonio | 39.73 | 7.89 | 54.59 | 5 | 4 | 7 | 8.39 |
| Snodgrass | 29.73 | 4.23 | 51.16 | 8 | 8.85 | 4 | 3.36 |
| Diangana | 33 | 8.89 | 51.89 | 0 | 1.4 | 2 | 1.21 |
| Shots on target % (19/20) | Dribbles per 90 (19/20) | Dribbles Success % (19/20) | Assists (19/20) | Expected Assists (19/20) | Goals (19/20) | Expected Goals (19/20) | |
| Anderson | 33.33 | 7.20 | 55.47 | 6 | 4.6 | 1 | 2.07 |
| Antonio | 41.94 | 6.74 | 53.33 | 2 | 2.37 | 2 | 4.52 |
| Snodgrass | 37.04 | 3.82 | 47.13 | 5 | 4.37 | 5 | 2.76 |
| Diangana | 40.63 | 8.24 | 51.52 | 5 | 4.67 | 5 | 3.37 |
Another area that Anderson is criticised for is his passing ability which people would argue impacts our ability to attack effectively. What is obvious from the stats is that Anderson’s in some areas his passing numbers has dropped, but would show adaptation of his game. With Anderson starting position being further back & we see the opportunity to play through balls have been a little limited. The frequency to which they are attempted has dropped by 0.54 per 90 with the success rate dropping also by 6% when trying to force play positively. In contract Antonio makes only 0.69 attempts with only a 33.33% success rate, whereas Snodgrass whilst attempting less that 18/19 his 0.66 attempts are more successful at 53.33%. Whilst it is clear aspects of his passing game has declined this year other aspects has improved such the success of his progressive passes at 83.13%. What this means for West Ham is that Anderson is managing to progress play & find his teammates with greater regularity than previously. Therefore in situations where Snodgrass is used in his stead the team receive 4.66 less progressive passes with less accuracy too at only 69% success rate. No player either bar Diangana currently at West Brom complete as many key passes per game than Anderson with 0.84.With Anderson in the opportunities for teammates happen with great regularity which would indicate his vision & ability the recognise patterns of play better than the likes of Antonio & Snodgrass.
| | PP per 90 (18/19) | PP Success % (18/19) | OD won % (18/19) | KP per 90 (18/19) | PTPA Per 90 (18/19) | TP per 90 (18/19) | TP per 90 Success % (18/19) |
| Anderson | 8.97 | 79.29 | 43.43 | 0.58 | 5.23 | 2.57 | 40.21 |
| Antonio | 4.13 | 72.50 | 38.46 | 0.76 | 2.7 | 0.76 | 36.36 |
| Snodgrass | 5.73 | 83.43 | 43.71 | 0.44 | 2.55 | 0.85 | 23.06 |
| Diangana | 5.27 | 65.63 | 42.08 | 1.06 | 3.5 | 1.81 | 35.35 |
| | PP per 90 (19/20) | PP Success % (19/20) | OD won % (19/20) | KP per 90 (19/20) | PTPA Per 90 (19/20) | TP per 90 (19/20) | TP per 90 Success % (19/20) |
| Anderson | 8.4 | 83.13 | 43.65 | 0.84 | 4.78 | 2 | 34.21 |
| Antonio | 3.55 | 76.09 | 34.93 | 0.69 | 2.7 | 0.69 | 33.33 |
| Snodgrass | 4.49 | 69 | 39.91 | 0.44 | 2.55 | 0.66 | 53.33 |
| Diangana | 3.74 | 83.33 | 41.73 | 1.06 | 3.5 | 1.25 | 20 |
Conclusion
Anderson has had a difficult second season but there are promising signs that should West Ham improve the key problem areas Anderson could be back to his best. There is a level of consistency which does need to improve with Anderson, but statically steady & predominately towards the top of the squad for midfielders across all disciplines. There seems to be an unfair perception upon Anderson as to his ability in & out of possession in relation to his teammates. For me I feel this misconception or underappreciation for what Anderson does is in relation to his intensity. The likes of Antonio & Snodgrass always appear to be at full velocity but that doesn’t necessarily mean they are in control or effective for their teammates which is supported in stats. In short, I believe Anderson is an underappreciated & important member of our squad & a poorer side without him playing. There are areas of improvement but feel if relieved of his defensive burdens can engage further up the field & start to turn in performances with more goals & assists.
